

Do you remember why you started using QuickBooks? You may have simply wanted to produce sales forms and record payments electronically. Gradually, you expanded your use of the software, perhaps paying and tracking bills through it and keeping an eagle eye on your inventory levels. Certainly, you’ve run at least some of the pre-built report templates offered by all versions of QuickBooks since their inception.
QuickBooks’ automation of your daily bookkeeping tasks has undoubtedly served you well. But that’s merely limited use; now it’s time to take advantage of QuickBooks’ greatest strength: customizable reports.
One of the rewards for diligently entering all of your accounting information is a better grasp of your company’s financial performance to date. That insight ultimately leads to better business decisions that can contribute to your future growth and success.
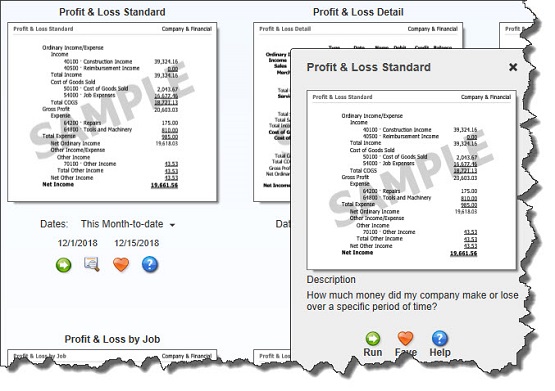
Figure 1: QuickBooks’ Report Center can help you learn about what each report is designed to tell you. But smart customization requires deeper insight.
Making Reports Meaningful
Like many other tasks in QuickBooks, report customization tools aren’t that difficult to master. What’s challenging is:
- Understanding what each report is designed to tell you
- Determining which reports are most relevant to your business information needs, and
- Designing each to produce the critical insight you need in order to move forward.
The first of these is fairly clear. You can understand what many reports do by their titles, their content, and the descriptions QuickBooks offers. We recommend that you spend some time looking at the Report Center in QuickBooks to familiarize yourself with your options.
The second two challenges are a bit more formidable. It’s our job to assist you in establishing a workflow in QuickBooks to keep accurate records and produce necessary transactions. But we want you to do more than just maintain the status quo. When you analyze and interpret what your reports are telling you, you can make smart business decisions.
So if we haven’t gone over this with you already, we encourage you to schedule some time with us so you can get the maximum benefit from your QuickBooks reports.
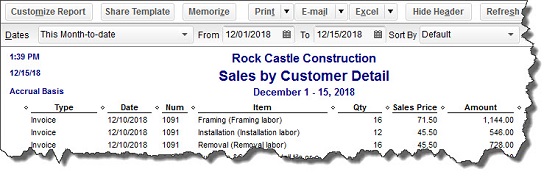
Figure 2: You can’t miss QuickBooks’ customization link when you open a report. But the trick is knowing how to best use its options for your business.
A Simple Set of Steps
Let’s take a look at a report you may already be generate: Sales by Customer Detail (Reports | Sales | Sales by Customer Detail). QuickBooks comes with a commonly-used set of default columns in its reports. This particular report contains column labels like Type (invoice, sales receipt, etc.), Item and Quantity, and Sales Price. You can easily change the date range that’s offered as a default up below the toolbar. But to get to QuickBooks’ powerful customization tools, click Customize Report. A window with four tabs opens. They are: Display. Options in this window help you specify the columns you want to appear in your report. In the lower left corner, there’s a list titled Columns that contains every possible column label for that report. If you scroll down, you’ll see a check mark in front of the default columns. Click on any of those to uncheck them, and click in front of any that you’d like to add. Other options here include how your data should be totaled and sorted. Some reports let you choose between cash and accrual basis. Filters. This is the difficult one–and the tool that will provide the most insight. Filters determine which subsets of related data you’ll see (accounts, items, customer types, zip codes, etc.) by including only those that meet certain conditions. Here’s where we can really help you answer critical business questions that will lead you to smart decisions.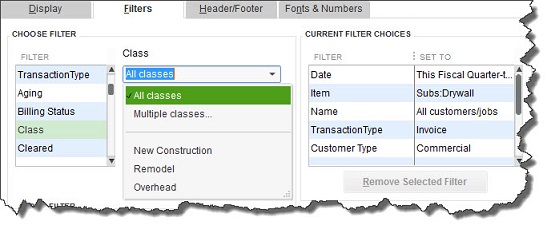
Figure 3: In this example, you’ve created a filter that will find all commercial drywall jobs that have been invoiced in the current fiscal quarter. You could narrow this report further by, for example, class, state, and paid status.
Header/Footer and Fonts & Numbers. You can tailor the design and layout of your reports here.
Well-formulated reports can help you spot cash flow problems, maintain the right inventory levels, see which jobs are the most profitable, and compare your estimates to actual costs. You’ll also be able to identify your best customers, your most sought-after items, and your most successful sales reps. Careful customization of your reports–and thorough analysis of their data–will make the answers to your constant questions about your company’s future direction much clearer. We can help you take full advantage of these powerful tools.